
Shopware Analytics
To utilize the Shopware Analytics extension, it is necessary to share your data. By providing us with your data, you assist us in enhancing our platform and developing new features and services. This enables us to actively improve our services using advanced technologies such as machine learning and specialised pattern recognition. The analysis of this data propels the continuous development of our product and promotes data-driven services for business success.
App activation
Due to incompatibilities, two versions are available depending on the version of your shop: one for Shopware 6.5 and one for Shopware 6.6 and higher.
- Shopware version 6.5 -> App version 1.4.x
- Shopware version 6.6 and higher -> App version 2.4.x
The Shopware Analytics extension expands the analysis options of your shop. Once you have installed the extension, you will find the new analyses in the Dashboard > Analytics menu.

To use this service, it is necessary that you to grant Shopware access to your data so that we can analyse orders, customers, payments, etc.
Some data calculations are currently taking place on your system. You should therefore be aware that large amounts of data can have an impact on system performance.
Configuration

Time period
In the top right-hand corner, you can select the time period (1) you would like to analyse.

There are fixed selection options such as yesterday, the last 6 months, the current year or you can specify a time period that you would like to view.
Filter
You can also specify further filter conditions under Filter (2).

The following filter options are available to you:
Sales channel: Here you can choose between the sales channels of your shop if the statistics should only be displayed for one or a selection of the existing sales channels.
Country: In the selection field for the country, you can display certain countries to display the corresponding statistics. All countries from the country list in the admin are always available in the selection list, even if they are inactive.
Customer group: In the filter option for the customer group, you can select one or more customer groups that are available in your shop.
Customer account type: You can now break down the statistics by guest or registered customers.
Order status: Here you can easily filter by order status. Multiple selection is possible.
Payment status: This field allows you to filter by the payment status of the orders in your shop. It is possible to select several statuses at the same time and display the statistics for this.
Delivery status: The statistics for the delivery status can be queried via this selection field. Here you can also select and display several statuses at the same time.
Settings (Storefront Tracking)
In 2.4.0 and 1.4.0 we introduced new Analytics functions for storefronts based on event tracking. This means that KPIs and reports on your shop's customer journey can now be provided in Shopware Analytics. Event tracking is also a prerequisite for future, already planned KPIs and reports. Event tracking can currently be activated in standard storefronts. Integration for composable frontends and headless storefronts is planned for future updates.
To activate the tracking you find the button for the settings (3) at the top right.

In Storefront data tracking (1), you can activate or deactivate the individual sales channels for these statistics. You can set up your cookie management tool in the lower section Setup guide (2) of the settings by clicking on the various buttons. As soon as you have clicked on one of the buttons, a pop-up will appear with instructions that you can easily follow. Further down in the Setup guide (2), you will find a data protection paragraph that you can insert into the data protection page of your Shopping Experience.
After you have activated or deactivated data tracking for the storefront, the cache must be emptied via Settings > System > Caches & Indices.
Statistics
For each of the following statistics, you will receive additional information about the respective evaluation when you hover the mouse pointer over the info icon.
Through the context menu ...-icon, this action is available for each statistic:
Export as CSV - Download the evaluation data as a comma-separated file (CSV), which you can use, for example, in a spreadsheet.
In the Definition of the metric section, you’ll find additional details on each metric’s data source and calculation.
Backend (Backend metrics)
Total sales
This statistic shows you the total value of your orders for the evaluation period.

The report uses gross sales with status paid but without any fees or deductions .
Orders
In this analysis you can see the development of the number of orders. For example, you can see when the most orders are placed in your shop. The Y-axis shows you the number of orders, the X-axis gives you information about the time frame.

Average order value
The analysis periodically determines the average order value of all orders received during this period. The Y-axis shows you the average order value in your currency, while the X-axis gives you information for the time frame.

The gross sales of your order excluding shipping costs, discounts and fees are taken into account. The average value is calculated as the quotient of gross sales divided by the total number of all paid orders.
Payment methods
In this report, you can see which payment methods are used in your shop and in what proportion.

Customers
Track the development of the total number of your customers with this report. The Y-axis shows you the total number of customers, while the X-axis gives you information for the time frame.

New Customers
Use this analysis to find out which customer growth you had on which day in absolute figures. The Y-axis displays the total number of new customers, while the X-axis gives you information for the time frame.

Discounts and promotions
This evaluation shows you how your promotions and discounts were used by customers and how often they were activated.

Sales by manufacturer
This analysis shows you exactly how many products were sold per manufacturer.

With version 1.1.0, the function has also been added that you can now display the icons/logos of, for example, the shipping method, the payment method or many more in the tabular evaluations.
Sales by country
In this analysis you can see to which countries you have sold your products. You can switch between the billing address and the delivery address at the top right.

Product sales
With the help of this analysis, you can easily see which products have been sold in your store and how often. You also have the option of displaying all variant products individually or running them under the main product. You can change this using the button at the top right.

Shipping methods
This analysis gives you valuable insights into which shipping methods generate the most sales. This allows you to optimise your logistics strategy to achieve maximum results.

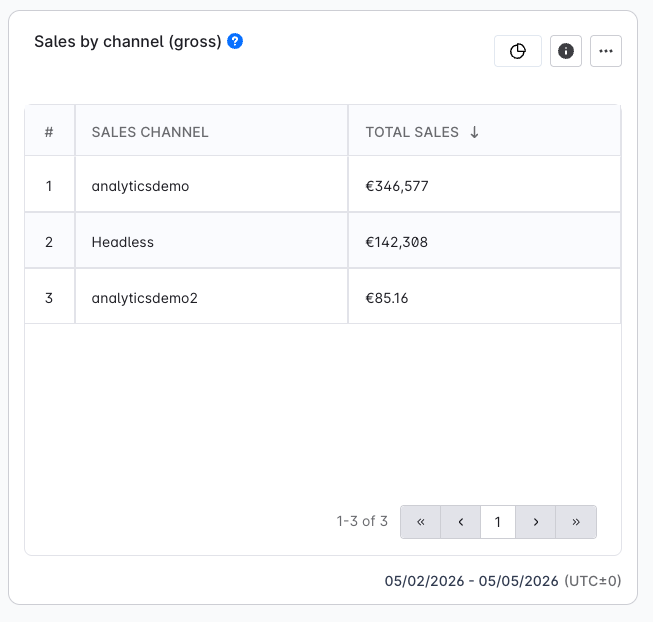
Sales by channel (gross)
The analysis shows the revenue by sales channel in the shop’s default currency. In the chart view, the five highest-revenue channels are displayed individually, while all remaining channels are grouped under “Others”.
Storefront (Storefront metrics)
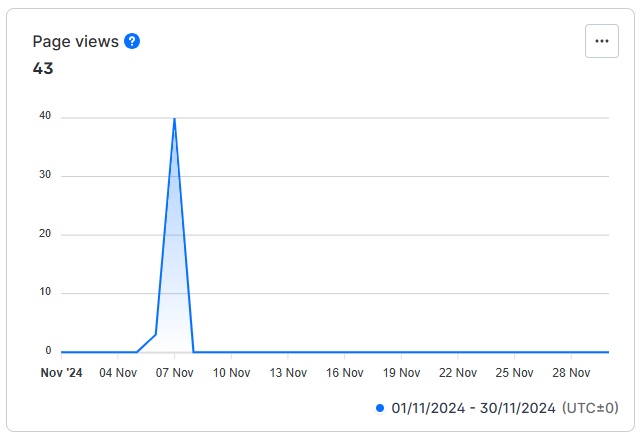
Page views
This key figure shows you all of your users' page views within the selected time period. Every visit to a page is counted, regardless of whether an individual user visits the same page several times.
Users are visitors to the storefront and logged-in customers as well as registered guest users.
You can use the other filters, such as ‘by country’ or ‘by customer group’, to fine-tune the display.
As soon as the cookies for Shopware Analytics are activated by the user in the storefront, page views are recorded.
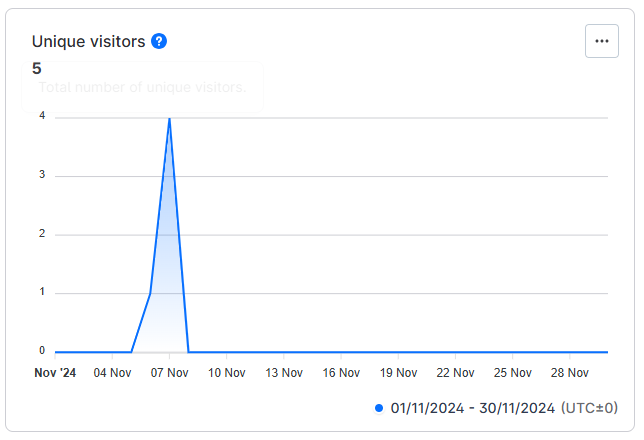
Unique visitors
This metric shows the total number of unique visitors who have visited your online store within a specific time period. Each visitor is counted only once, regardless of how many times they visit the website during that period.
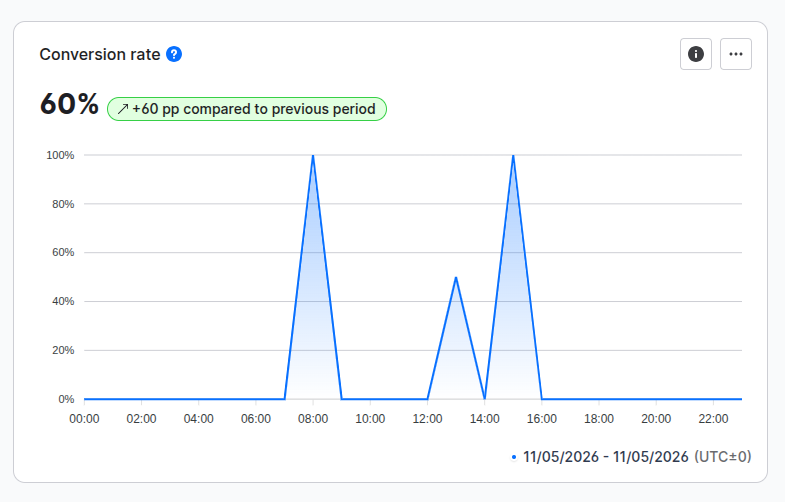
Conversion rate
The conversion rate shows how many of your shop visits result in orders. To calculate it, you divide the number of orders by the number of sessions.
A session is a continuous visit to your shop. It ends automatically after 30 minutes of inactivity.
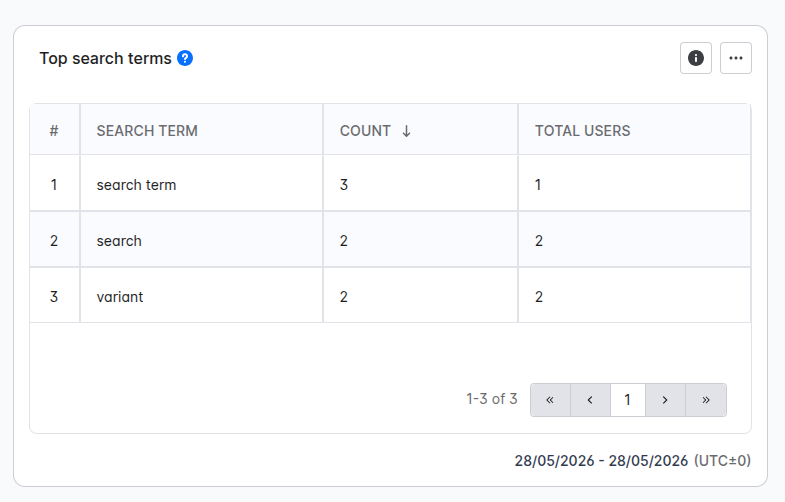
Top search terms
This metric displays the most frequently used search terms entered by visitors to your shop. It helps you understand what customers are searching for and which terms are used most often.
Search Term Normalization
To ensure that similar search queries are evaluated consistently, search terms are automatically normalized before they are stored.
The following adjustments are applied:
Invisible or invalid characters, such as control characters or zero-width characters, are removed.
Different types of whitespace are converted into standard spaces.
Multiple consecutive spaces are collapsed into a single space.
Leading and trailing spaces are removed.
All search terms are converted to lowercase.
As a result, the following search queries are treated as the same term:
Red Shoesred shoesred shoes
All of these queries become:
red shoes
Excluded Search Terms
A search term is not included if:
the term is empty after normalization,
the term consists only of whitespace or invalid characters,
the term exceeds 100 bytes in length.
The limit is based on byte length rather than character count. As a result, search terms written in non-Latin scripts may reach the limit sooner.
Current Limitations
The following features are currently not supported:
No stemming (
shoeandshoesare treated as different terms)No accent normalization (
caféandcafeare treated as different terms)No typo correction or fuzzy matching
No synonym recognition (
sneakersandtrainersare treated as different terms)No Unicode normalization
No stop-word removal (
the red shoesremains unchanged)
Purely numeric search terms or search terms consisting only of emojis are accepted as valid search queries.
Requirements:
This metric requires Shopware version 6.7.11.0 or higher.
Merchants using an older Shopware version will still see the metric, but a notice will indicate that an update to the required version is necessary to use it.
Definition of the metric
In the table you will find the various metrics and their data source in Shopware (database) as well as the respective definition/calculation.
| Metric | Data source in Shopware (Entities) | Definition / Calculation |
| Total sales |
| Definition: Gross value of all orders Calculation: TotalSales = Sum of (Gross sales in each interval / currency factor) * interval could be hour/day/month * value in default currency of the shop |
| Orders |
| Definition: Number of received orders Calculation: As definition |
| Average order value |
| Definition: Total net product value per number of received orders. Exclude discount, promotion and credit Calculation: |
| Payment methods |
| Definition: Percentage distribution of payment methods used. Calculation: |
| Customers |
| Definition: Accumulated total number of active customer accounts. Calculation: As definition |
| New customers |
| Definition: Number of newly registered customers Calculation: Table: customer |
| Discounts and promotions |
| Definition: Number of redeemed promotions codes Calculation: Value of each promotion code = Number of times a fixed promotion code is used in an order |
| Sales by manufacturer |
| Definition: Number of products sold by manufacturer Calculation: Sales of a manufacturer = Total sales quantity of all products and theirs variants that belong to that manufacturer |
| Sales by country |
| Definition: Number of orders by billing or shipping country Calculation: Sales of a country = Total number of orders that have this country as billing address (or shipping address depends on the chart filter) |
| Product Sales |
| Definition: Total quantity of products in orders. Variants can be displayed individually or grouped into a single product Sales of a product = Total sales quantity of all products and theirs variants |
| Shipping Methods |
| Definition: Percentage distribution of shipping methods used
|
| Sales by channel |
| Definition: Total revenue per sales channel for the selected period Calculation: Sales by channel = Sum of (Order amount per sales channel / currency factor) Note: Uses gross (amountTotal) or net (amountNet) depending on price type setting |
| Conversion rate | No data is retrieved from the shop. The data is stored on servers operated by shopware AG or by us. | Definition: The conversion rate is the ratio of sessions that resulted in an order to the total number of sessions. A session is defined as a continuous interaction by a visitor in the shop. A session ends when the visitor has been inactive for 30 minutes or when there is a change of user (e.g. by logging out). Calculation: converted sessions / total sessions * 100 |
| Top search terms | No data is retrieved from the shop. The data is stored on servers operated by shopware AG or by us. | Definition: The search terms most frequently used by your visitors are displayed. Calculation: The number of times a search term appears is counted. |
Troubleshooting
Understanding incorrect metrics or deviations
When analyzing metrics in Shopware Analytics, there are several reasons why figures might deviate from expectations or appear incorrect. These can range from variations in data processing to the level of customization in your Shopware setup.
Deviations between figures from different sources or tracking tools are normal and can result from factors such as consent rate, metric definitions, timeframes, data properties or how the data is processed by each individual tool. While some variation is expected, it should not deviate significantly from reality.
Shopware Analytics relies on the Shopware Standard for data collection and metric calculations. If your Shopware instance has been heavily customized, the figures in Shopware Analytics might be inaccurate or appear inconsistent. We can only ensure correct results when using the standard configuration.
Debugging
1. App registration for ‘SwagAnalytics’ failed: The app url changed. Please resolve how the apps should handle this change.
Explanation:
Every time a request should be made against an app backend, Shopware will check whether the current APP_URL differs from the one used when Shopware generated an ID for this shop.
Solution:
If the APP_URL differs, Shopware will stop sending any requests to the installed apps to prevent data corruption on the side of the apps.
Now the user has the possibility to resolve the solution by using one of the following strategies:
The user can either run a strategy with the bin/console app:url-change:resolve command, or with a modal that pops up when the Administration is opened.
Further information can be found here in the developer documentation.
2. Tracking activation doesn't work (Missing activation buttons in Settings)
This issue may occur if Shopware Analytics is installed in a restricted environment that cannot communicate with our App Server, such as a local test environment or a staging environment with limited access. Communication with the App Server is required to activate storefront tracking, process event data from your storefront, and provide metrics to Shopware Analytics.
If you want to use Storefront Tracking, first enable your Shopware environment for external communication. After, disable and then activate Shopware Analytics again. Now try to activate Storefront Tracking in the settings page.
3. analytics without function (staging environment)
Error message:
Shop is not active: sendAuthRequest@https://swag-analytics.apps.shopware.io/assets/init-app-Bk3R4CBr.js:817:71735If you are using a staging environment that uses a 1:1 copy of the database of the live system, please note the following:
In the system_config table, the entry core.app.shopId is copied identically. As a result, our app servers may no longer be able to distinguish between the staging and live systems, leading to connection problems.
However, this problem can be easily resolved. Execute the following command in the document root of the live system:
php bin/console app:url-change:resolve reinstall-appsThis will regenerate the ID in the core.app.shopId entry. Then install the Analytics extension again to complete the configuration correctly.
Event data
Some data is collected and sent with every event. This data cannot be overridden and can be viewed as the base data.
Base data
Context data
| Key | Description | Example |
| context.app | The type of the storefront (Storefront / Frontends) | 'storefront' | 'frontends' |
| context.locale | The shopper's preferred language | 'en-GB' |
| context.page.path | The page path on which the event occurred | '/Aerodynamic-Aluminum-PANEL-Performance-Area-Network-Electronic-Links’ |
| context.page.referrer | The page referrer on which the event occurred | 'https://www.shopware.com/en/' |
| context.page.search | The page search on which the event occurred | '?search=query' |
| context.page.title | The page referrer on which the event occurred | 'Electronics' |
| context.page.url | The page URL on which the event occurred | http://localhost:9998/Aerodynamic-Aluminum-PANEL-Performance-Area-Network-Electronic-Links |
| context.screen.density | The shopper's screen pixel ratio | 1.2 |
| context.screen.height | The shopper's screen height (in pixels) | 1080 |
| context.screen.width | The shopper's screen width (in pixels) | 1920 |
| context.timestamp | The timestamp (milliseconds) of when the event occurred | 1709559530285 (Date.now()) |
| context.timezone | The timezone of the shopper | 'Europe/Berlin' |
| context.userAgent | The user agent of the shopper | 'Mozilla/5.0 (Windows NT 10.0; Win64; x64) AppleWebKit/537.36 (KHTML, like Gecko) Chrome/58.0.3029.110 Safari/537.36' |
| context.userAgentData | The user agent data of the shopper (if available) | {"brands": [{"brand": "Not/A)Brand", "version": "8"}, {"brand": "Chromium", "version": "126"}, {"brand": "Brave", "version": "126"}], "mobile": false, "platform": "macOS"} |
| properties | The properties of the event | {Object} |
| timestamp | The timestamp (ISO string) of when the event occurred | '2024-03-04T13:38:50.285Z' |
| trackingId | The tracking ID | 'SW-8IY68RGJ7YM4LGYB' |
| type | The type of event that occurred | 'page' | 'track' | 'identify' |
| anonymousId | The visitor ID (not a customer specific PUID) | 'ed2bed5b-5185-4812-8ccf-ecd2bbb95e4d' |
Customer data
When a customer is logged in, the following additional data is sent:
| Key | Description | Example |
| customer.customerGroupName | The shopper's customer group name | 'Standard customer group' |
| customer.customerGroupId | The shopper's customer group ID | 'fe8d2c9b0a3f4df3a6bf8e2edcc28bc2' |
| customer.guest | Boolean to identify if this is a guest customer or not | false |
Page view data
When a page view is tracked, the following properties are sent:
| Key | Description | Example |
| properties.category | The category of the page | 'Home page' | 'Landing page' | 'Product listing' | 'Product detail' | 'Checkout' | 'Cart' | 'Other' (list to be completed) |
| properties.name | The name of the page | 'Finish checkout' (list to be completed) |
| properties.title | The title of the page | 'Home' (document.title) |
| properties.path | The path of the page | '/Aerodynamic-Steel-SpotOn/018da6ccad3673c0b52c0dbe78cccfdd' (location.pathname) |
| properties.url | The url of the page | 'http://localhost:9998/Aerodynamic-Steel-SpotOn/018da6ccad3673c0b52c0dbe78cccfdd' (location.href) |
| properties.referrer | properties.referrer | 'https://shopware.com' (document.referrer) |
| properties.search | The search | '?search=query' (location.search) |
The Storefront integration adds the additional properties:
| Key | Description | Example |
| properties.storefrontAction | The Storefront action | 'home' |
| properties.storefrontCmsPageType | (Optional) The CMS page type | 'page' | 'landingpage' | 'product_list' | 'product_detail' |
| properties.storefrontController | The Storefront controller | 'navigation' |
| properties.storefrontRoute | The Storefront route | 'frontend.home.page' |
Track event data
A track event represents any action a user takes on your website, such as adding a product to the cart or completing a purchase. When a track event is sent, the following properties are sent:
| Key | Description | Example |
| eventName | The unique name of the track event type | order:created |
order:created
| Key | Description | Example |
| orderId | The ID of a placed order | f47ac10b-58cc-4372-a567-0e02b2c3d479 |